Great retention, Wrong cohort
The other day, I was looking at the retention cohort of a company in the e-commerce space, that sells stuff that should be bought regularly.
This company has great traction, they have a lot of orders from repeating customers, and yet their cohort abruptly drops after the first month.

That’s even more weirder when in theory, the tail of the retention cohort should give information about Product-Market Fit (ie. equal to the % of people you acquired in top-of-funnel that reached Product-Market Fit)
A week later, I was with a company that ships an IoT device, and the cohort analysis of their mobile app made absolutely no sense, with unexplainable weird peaks.
Metrics are designed for high-frequency usage⌗
The problem is simple : most of the metrics you see are designed for products with very high-frequency usage (mobile consumer apps like Facebook and Snapchat, most SaaS businesses, …) 📈
However, a lot of products are meant to be interacted much less frequently, but still provide a lot of value. You can’t analyse both in the same way!
How do you think the consumer cohort of a car manufacturer looks like, month over month? 😃 Yes, that is a ridiculous question because it simply doesn’t make sense, people don’t buy cars every month, not even every quarter. The cohort of any business depends on usage frequency.
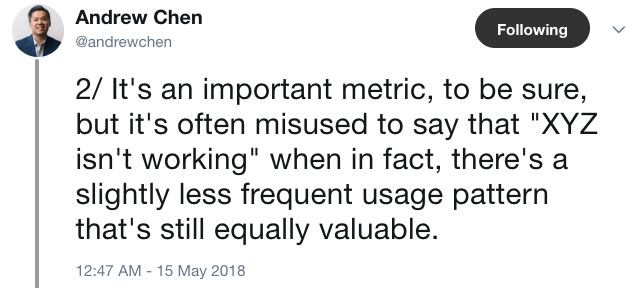
Andrew Chen did a very interesting tweet-storm about this problem for the DAU/MAU metric, but the problem is also present for cohorts.

Why does it mess cohorts?⌗
Let’s take the example of an imaginary e-commerce company with 100% retention :
-
Every month they acquire 1 000 new clients ;
-
100% of users re-order every 2 months (because they buy for 2 months worth of supply and re-stock every 2 months) ;
-
50% of users re-order once on M+1 *(because they started with the small starter-kit) *and then re-order every 2 months.
Now, let’s do the monthly cohort analysis.

By looking at the cohort analysis, you’ll have the impression that 50% of the customers dropped 😱
However in reality, 100% of customers have retained! 😲
The problem can sometimes be worse, and you might even see weird peaks in your cohorts. The cohort might even sometimes never converge.
How to solve it?⌗
There’s two ways to solve it
1. Adapt your cohort to the period⌗
If people do the action every X weeks/months, use this as the time basis for the cohort analysis.
For the previous example, as people buy every 2 months, if we draw the cohort analysis on a 2 months period, we’ll get this result :

By using the proper time basis, we are now able to see that no customers dropped.
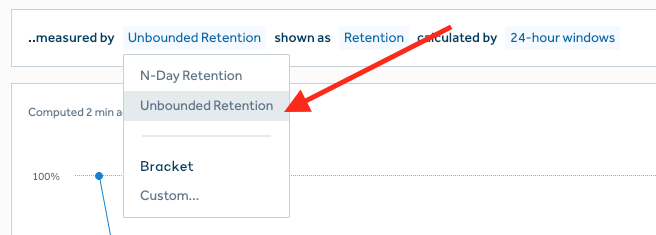
For instance Amplitude enables you to customize the retention brackets directly in the retention panel.
2. Use “Unbounded Cohorts”⌗
Some analytics tools like Amplitude Analytics offer you two kind of cohorts : “N-Day Retention” and “Unbounded Retention”.

Usually cohorts that you see are “N-Day” : a customer comes on day 1 and on day 3, you’ll see them on day 1, on day 3, but not on day 2.
However, you can also use “Unbounded Retention” cohorts : on this case, a customing coming on day 1 and day 5, will be counted on day 1, 2, 3, 4 and 5.
On the case of a high-frequency product, the N-Day retention is often a better choice. However, if your product is low-frequency, you can use an Unbounded Retention for more visibility.
You can learn more about the two kind of cohorts here.
With a clean cohort, you’ll now be able to understand your retention and Product-Market Fit more clearly 🚀 💥
—
At Kima Ventures we’re a super business-angel closing 2 investments per week from Seed to Series A. If you have a cool project, or if you just want to chat, feel free to drop a line ;) -> alexis AT kimaventures DOT com